
Page 44 - economic report 2021
P. 44
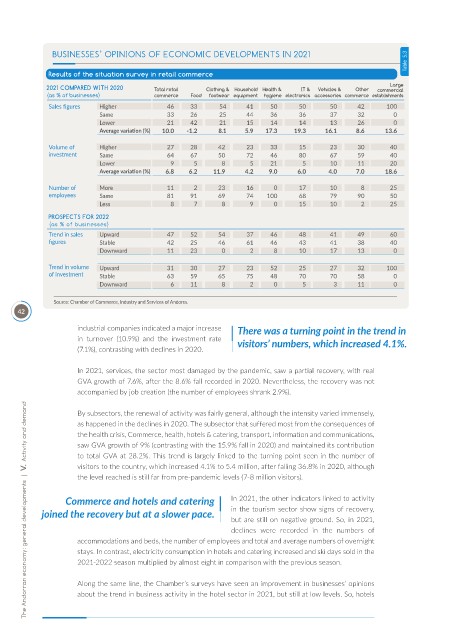
Table  5.3
               BUSINESSES’ OPINIONS OF ECONOMIC DEVELOPMENTS IN 2021

              Results of the situation survey in retail commerce
                                                                                                        Large
             2021 COMPARED WITH 2020      Total retail   Clothing &  Household Health &   IT &   Vehicles &   Other   commercial
             (as % of businesses)         commerce  Food  footwear equipment  hygiene electronics accessories commerce establishments
              Sales figures  Higher          46    33      54     41    50      50      50     42      100
                           Same              33    26      25     44    36      36      37     32        0
                           Lower             21    42      21     15    14      14      13     26        0
                           Average variat on (%)  10.0  -1.2  8.1  5.9  17.3  19.3     16.1    8.6    13.6

              Volume of    Higher            27    28     42      23    33      15      23     30       40
              investment   Same              64    67     50      72    46      80      67     59       40
                           Lower              9     5      8       5    21       5      10     11       20
                           Average variat on (%)  6.8  6.2  11.9  4.2   9.0    6.0      4.0    7.0    18.6
              Number of    More              11     2     23      16     0      17      10      8       25
              employees    Same              81    91     69      74   100      68      79     90       50
                           Less               8     7      8       9     0      15      10      2       25
              PROSPECTS FOR 2022
              (as % of businesses)
              Trend in sales   Upward        47    52     54      37    46      48      41     49       60
              f gures      Stable            42    25     46      61    46      43      41     38       40
                           Downward          11    23      0       2     8      10      17     13        0
              Trend in volume   Upward       31    30     27      23    52      25      27     32      100
              of investment  Stable          63    59     65      75    48      70      70     58        0
                           Downward           6    11      8       2     0       5       3     11        0

               Source: Chamber of Commerce, Industry and Services of Andorra.
      42
                     industrial companies indicated a major increase   There was a turning point in the trend in
                     in  turnover  (10.9%)  and  the  investment  rate   visitors’ numbers, which increased 4.1%.
                     (7.1%), contrasting with declines in 2020.

                     In 2021, services, the sector most damaged by the pandemic, saw a partial recovery, with real
                     GVA growth of 7.6%, after the 8.6% fall recorded in 2020. Nevertheless, the recovery was not
                     accompanied by job creation (the number of employees shrank 2.9%).
        The Andorran economy: general developments  |  V.  Activity and demand
                     By subsectors, the renewal of activity was fairly general, although the intensity varied immensely,
                     as happened in the declines in 2020. The subsector that suffered most from the consequences of
                     the health crisis, Commerce, health, hotels & catering, transport, information and communications,
                     saw GVA growth of 9% (contrasting with the 15.9% fall in 2020) and maintained its contribution
                     to total GVA at 28.2%. This trend is largely linked to the turning point seen in the number of
                     visitors to the country, which increased 4.1% to 5.4 million, after falling 36.8% in 2020, although
                     the level reached is still far from pre-pandemic levels (7-8 million visitors).

                  Commerce and hotels and catering            In 2021, the other indicators linked to activity

            joined the recovery but at a slower pace.         in the tourism sector show signs of recovery,
                                                              but are still on negative ground. So, in 2021,
                                                              declines  were  recorded  in  the  numbers  of
                     accommodations and beds, the number of employees and total and average numbers of overnight
                     stays. In contrast, electricity consumption in hotels and catering increased and ski days sold in the
                     2021-2022 season multiplied by almost eight in comparison with the previous season.

                     Along the same line, the Chamber’s surveys have seen an improvement in businesses’ opinions
                     about the trend in business activity in the hotel sector in 2021, but still at low levels. So, hotels