
Page 39 - economic report 2021
P. 39
SUMMARY OF INDICATORS OF ACTIVITY AND DEMAND (interannual variation rates, %) Table 5.1
2020 2021
Activity
Establishments (1) 4.0 7.9
Employment 1.0 2.4
Employees -3.0 -2.0
Industry 5.2 -3.3
Construct on 4.3 6.9
Services -4.1 -2.9
Unemployment 68.4 0.1
Job seekers 132.2 -10.1
Number of visitors -36.8 4.1
Electricity consumpt on (2) -17.5 8.1
Imports -5.0 1.0
Demand
Average wage 0.7 1.8
Car registrat ons -19.9 23.5
Industrial vehicle registrat ons -37.5 12.1
Imports of capital goods (3) -14.8 10.0
Imports of building materials (4) -16.6 48.7
Credit from banking ent t es (5) 4.5 10.4
Government operat ng expenses (6) -2.2 3.2
Government real investment (6) -32.4 6.2
(1) Establishments registered with the Registry of Commerce and Industry that carry out a commercial, industrial or service act vity.
(2) Except domest c use, public light ng and other distributors.
(3) Includes chapters 84 and 85 under the Andorran Customs classif cat on.
(4) In 2021, the def nit on of building materials was expanded and now includes chapters 25, 68-70, 72-76 and 78-81, under the Andorran 37
Customs classif cat on. The 2020 data have been revised under this new def nit on.
(5) Gross lending to customers.
(6) Set led f gures, includes Central and Comú governments.
Source: own preparat on, using data provided by the Department of Stat st cs, Central and Comú governments, CASS, FEDA and Andorran Banking.
completely normalised business in relation to
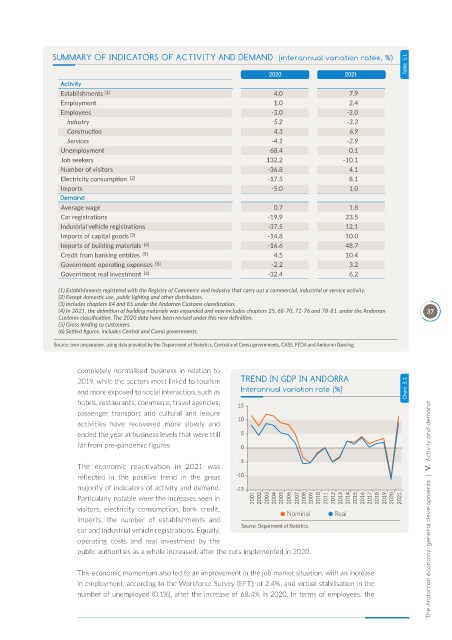
2019, while the sectors most linked to tourism TREND IN GDP IN ANDORRA
and more exposed to social interaction, such as Interannual variation rate (%) Chart 5.1
hotels, restaurants, commerce, travel agencies,
passenger transport and cultural and leisure
activities have recovered more slowly and
ended the year at business levels that were still
far from pre-pandemic figures
The economic reactivation in 2021 was
reflected in the positive trend in the great
majority of indicators of activity and demand.
Particularly notable were the increases seen in
visitors, electricity consumption, bank credit, Nominal Real The Andorran economy: general developments | V. Activity and demand
imports, the number of establishments and
car and industrial vehicle registrations. Equally, Source: Department of Stat st cs.
operating costs and real investment by the
public authorities as a whole increased, after the cuts implemented in 2020.
This economic momentum also led to an improvement in the job market situation, with an increase
in employment, according to the Workforce Survey (EFT), of 2.4%, and virtual stabilisation in the
number of unemployed (0.1%), after the increase of 68.4% in 2020. In terms of employees, the