
Page 30 - economic report 2021
P. 30
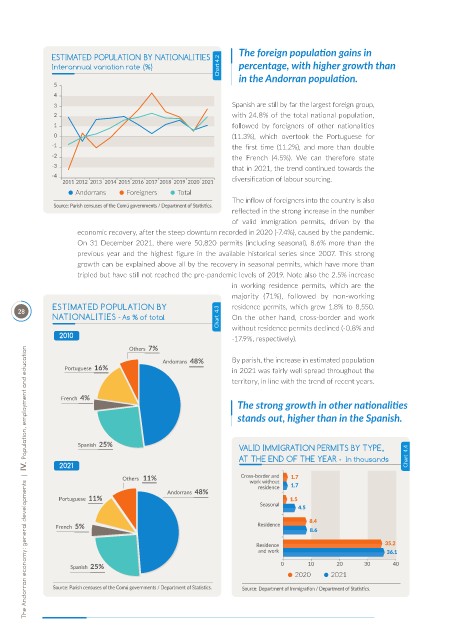
The foreign populat on gains in
               ESTIMATED POPULATION BY NATIONALITIES
               Interannual variation rate (%)              Chart 4.2   percentage, with higher growth than

               5                                                in the Andorran populat on.
               4
               3                                              Spanish are still by far the largest foreign group,
               2                                              with 24.8% of the total national population,
               1                                              followed  by  foreigners  of  other  nationalities
               0                                              (11.3%),  which  overtook  the  Portuguese  for
               -1                                             the  first  time  (11.2%),  and  more  than  double
               -2                                             the  French  (4.5%).  We  can  therefore  state
               -3                                             that in 2021, the trend continued towards the
               -4                                             diversification of labour sourcing.
                  2011 2012 2013 2014 2015 2016 2017 2018 2019 2020 2021
                     Andorrans    Foreigners    Total
                                                              The inflow of foreigners into the country is also
               Source: Parish censuses of the Comú governments / Department of Stat st cs.
                                                              reflected in the strong increase in the number
                                                              of  valid  immigration  permits,  driven  by  the
                     economic recovery, after the steep downturn recorded in 2020 (-7.4%), caused by the pandemic.
                     On 31 December 2021, there were 50,820 permits (including seasonal), 8.6% more than the
                     previous  year  and  the  highest  figure  in  the  available  historical  series  since  2007.  This  strong
                     growth can be explained above all by the recovery in seasonal permits, which have more than
                     tripled but have still not reached the pre-pandemic levels of 2019. Note also the 2.5% increase
                                                              in  working  residence  permits,  which  are  the
                                                              majority  (71%),  followed  by  non-working
               ESTIMATED POPULATION BY                        residence  permits,  which  grew  1.8%  to  8,550.
      28
               NATIONALITIES - As % of total               Chart  4.3  On  the  other  hand,  cross-border  and  work
                 2010                                         without residence permits declined (-0.8% and
                                                              -17.9%, respectively).
        The Andorran economy: general developments  |  IV.  Population, employment and education
                                                              By parish, the increase in estimated population
                                                              in 2021 was fairly well spread throughout the
                                                              territory, in line with the trend of recent years.


                                                                The strong growth in other nat onalit es
                                                                stands out, higher than in the Spanish.


                                                                VALID IMMIGRATION PERMITS BY TYPE,
                                                                AT THE END OF THE YEAR -  In thousands      Chart  4.4
                 2021


                                                                               2020     2021
               Source: Parish censuses of the Comú governments / Department of Stat st cs.  Source: Department of Immigrat on / Department of Stat st cs.