
Page 18 - economic report 2021
P. 18
(22% and 18% of GVA, respectively), a sector The economic prospects for 2022-2023
that has been especially affected by the are clouded by the war in Ukraine.
bottlenecks and rising cost of a large part of
their inputs. Nevertheless, in 2022, public
investment as a percentage of GDP is expected to reach the highest level in the last decade
thanks to the Next Generation EU programme.
In 2022, inflation is still expected to be high for the Eurozone as a whole, fed by rising commodity
prices due to the war and the knock-on effect of energy and food prices on the rest of the
consumer basket, and also the possible second-round effects through wages. This is the prediction
of OECD forecasts, with 7.0% inflation in 2022, which would only slow to 4.6% in 2023.
Nevertheless, the scale of the economic impact is still uncertain and will largely depend on
the length of the conflict, the sanctions on Russia and any economic policies that might be
implemented. What seems clear is that the war will cause a major reduction in growth and will
increase inflation, impacting unevenly by regions and with Europe as the most affected area.
In summary, the world has suffered another deep, transformative shock. Just when it seemed that
a lasting recovery was on the books after the global economic collapse caused by the pandemic,
the war between Ukraine and Russia evaporated part of this progress and generated further
uncertainties for the future. Such a complex situation requires a suitable, effective response from
the economic authorities. On the one hand, the need to consolidate the public deficits should
not prevent governments from prioritising spending that is focussed on the vulnerable segments
of the population; on the other hand, central banks must act to stop inflationary pressures while
avoiding a slowdown in economic growth.
16
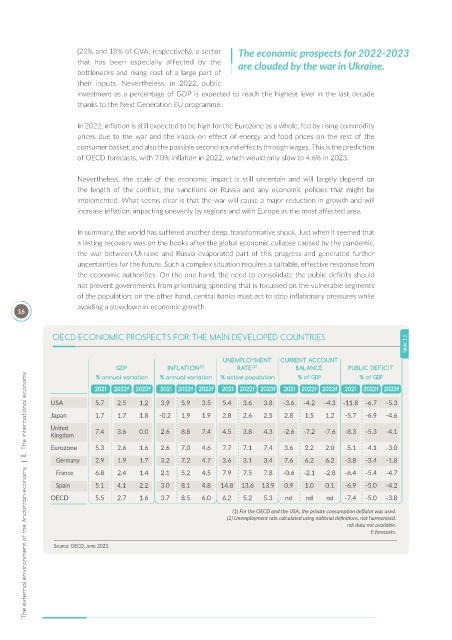
OECD ECONOMIC PROSPECTS FOR THE MAIN DEVELOPED COUNTRIES
Table 1.2
UNEMPLOYMENT CURRENT ACCOUNT
GDP INFLATION (1) RATE (2) BALANCE PUBLIC DEFICIT
The external environment of the Andorran economy | I. The international economy
% annual variation % annual variation % active population % of GDP % of GDP
2021 2022f 2023f 2021 2022f 2023f 2021 2022f 2023f 2021 2022f 2023f 2021 2022f 2023f
USA 5.7 2.5 1.2 3.9 5.9 3.5 5.4 3.6 3.8 -3.6 -4.2 -4.3 -11.8 -6.7 -5.3
Japan 1.7 1.7 1.8 -0.2 1.9 1.9 2.8 2.6 2.5 2.8 1.5 1.2 -5.7 -6.9 -4.6
United 7.4 3.6 0.0 2.6 8.8 7.4 4.5 3.8 4.3 -2.6 -7.2 -7.6 -8.3 -5.3 -4.1
Kingdom
Eurozone 5.3 2.6 1.6 2.6 7.0 4.6 7.7 7.1 7.4 3.6 2.2 2.0 -5.1 -4.1 -3.0
Germany 2.9 1.9 1.7 3.2 7.2 4.7 3.6 3.1 3.4 7.6 6.2 6.2 -3.8 -3.4 -1.8
France 6.8 2.4 1.4 2.1 5.2 4.5 7.9 7.5 7.8 -0.6 -2.1 -2.8 -6.4 -5.4 -4.7
Spain 5.1 4.1 2.2 3.0 8.1 4.8 14.8 13.6 13.9 0.9 1.0 0.1 -6.9 -5.0 -4.2
OECD 5.5 2.7 1.6 3.7 8.5 6.0 6.2 5.2 5.3 nd nd nd -7.4 -5.0 -3.8
(1) For the OECD and the USA, the private consumpt on def ator was used.
(2) Unemployment rate calculated using nat onal def nit ons, not harmonised.
nd: data not available.
f: forecasts.
Source: OECD, June 2022.