
Page 14 - economic report 2021
P. 14
The underlying inflation rate (excluding volatile
COMMODITY PRICES components such as energy and unprocessed
(Index 2016=100) Chart 1.4 food) also saw a certain rebound (1.5%), but
250 considerably smaller and always less than the
230 target set by ECB monetary policy (2%). The
210 main Eurozone economies recorded annual
190 inflation rates of close to 2%, such as in France
170 (2.1%) and Italy (1.9%), or 3%, as in Germany
150 (3.2%) and Spain (3.0%).
130
110
Public finances have been seriously affected
90
70 by the health emergency. In the Eurozone as
2019 2020 2021 2022 a whole, the public deficit went from 0.7% of
GDP in 2019 to 7.1% in 2020, then shrank to
Commodit es Basic Industrial
foodstuf s (1) inputs (2) 5.1% in 2021. The reduction of the deficit last
year was the result of a decrease in expenditure
(1) Includes the price indexes for cereals, vegetable oils, meat, shellf sh,
sugar and other foodstuf s. as a percentage of GDP (going from 53.6%
(2) Includes the price indexes for wood, cot on, wool, rubber and skins
(agricultural commodit es) and the price indexes for aluminium, cobalt, to 52.4%), and an increase in income by one
copper, iron ore, lead, molybdenum, nickel, t n, uranium and zinc (metals). point to 47.3% of GDP. Yet again, it was the
Source: IMF Commodity Prices. large European countries with the highest
public account deficits (above 6%) that felt the
The Eurozone public def cit improved greatest economic impact from the pandemic
from 7.1% GDP in 2020 to 5.1% in 2022. (Greece, Italy, Spain and France, among others).
Remember that the European Commission has
extended suspension of the fiscal rules that
12
set a public deficit limit of 3% until 2023, since the community’s priorities consist of providing
continued support to the recovery in growth and employment.
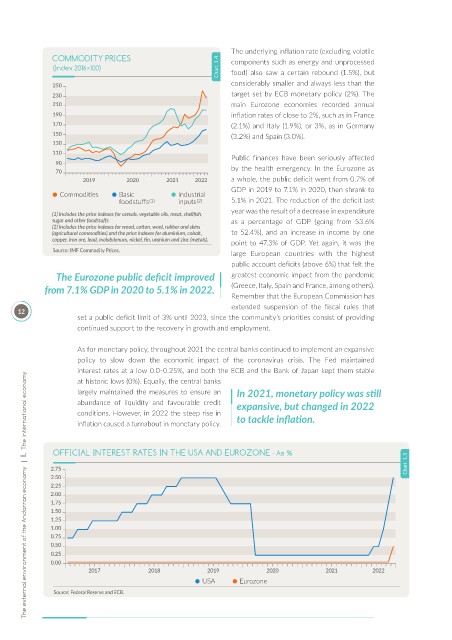
As for monetary policy, throughout 2021 the central banks continued to implement an expansive
policy to slow down the economic impact of the coronavirus crisis. The Fed maintained
interest rates at a low 0.0-0.25%, and both the ECB and the Bank of Japan kept them stable
The external environment of the Andorran economy | I. The international economy
at historic lows (0%). Equally, the central banks
largely maintained the measures to ensure an In 2021, monetary policy was st ll
abundance of liquidity and favourable credit expansive, but changed in 2022
conditions. However, in 2022 the steep rise in to tackle inf at on.
inflation caused a turnabout in monetary policy.
OFFICIAL INTEREST RATES IN THE USA AND EUROZONE - As %
Chart 1.5
USA Eurozone
Source: Federal Reserve and ECB.