
Page 88 - economic report 2021
P. 88
buildings to be well insulated and weatherproofed. The data shows that the sector is experiencing
a major period of growth and investor confidence.
The increase in approved surface area in 2021 was generalised by categories, with three-digit
rates. 69% of the approved surface area relates to new builds, increasing 209% since 2020; 28%
relates to renovations, with 115% growth, and the other 4% relates to demolition or extensions.
In 2021, the approved surface area for renovation saw a record figure, which can be attributed
to the energy efficiency regulations and the Renova Plan, and mainly the Law 15/2020, of 26
November, on urgent measures regarding urban leases and to improve purchasing power, which
allows for the renovation of housing that is outside the regulations.
2
On the other hand, in 2021, 215,964 m of new building was authorised. This figure represents an
increase of 50.8% compared with 2020, which saw a steep downward trend (-39.6%). In parallel,
the number of authorised permits increased from 58 in 2020 to 83 in 2021, reaching the highest
figure since 2004, when the highest number of authorised square metres of new building in the
whole available historical series was also recorded.
Strong activity in the sector was matched by very dynamic demand. According to the statistics
for property transactions and for housing and land prices, 1,948 property transactions were
carried out in 2021, the highest number in the historical series, and 48% more than in the
previous year. After the declines seen in 2019 and 2020, the number of transactions regained the
positive trend of the period 2013-2018. In 2021, many foreign investors, mostly from Spain and
France, decided to buy a residence in the Principality, taking advantage of the low interest rates and
savings amassed over the pandemic. To this was
added the attraction of professional residents In 2021, property sales
86
with high purchasing power, encouraging the increased 48%.
construction of luxury housing.
The Andorran economy: developments in the main sectors | XI. Construction and related industries
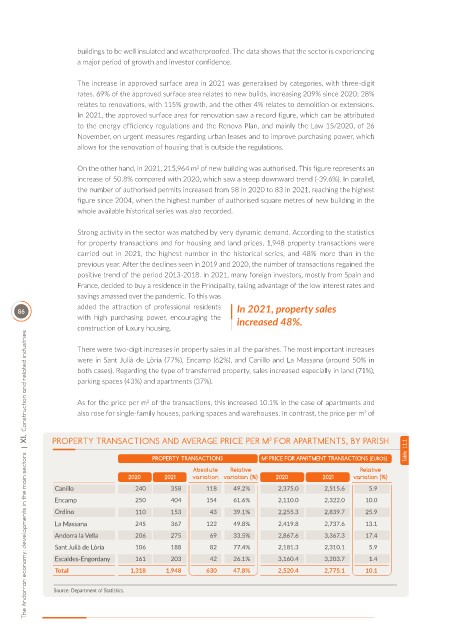
There were two-digit increases in property sales in all the parishes. The most important increases
were in Sant Julià de Lòria (77%), Encamp (62%), and Canillo and La Massana (around 50% in
both cases). Regarding the type of transferred property, sales increased especially in land (71%),
parking spaces (43%) and apartments (37%).
As for the price per m of the transactions, this increased 10.1% in the case of apartments and
2
also rose for single-family houses, parking spaces and warehouses. In contrast, the price per m of
2
PROPERTY TRANSACTIONS AND AVERAGE PRICE PER M FOR APARTMENTS, BY PARISH
2
Table 11.1
PROPERTY TRANSACTIONS M PRICE FOR APARTMENT TRANSACTIONS (EUROS)
2
Absolute Relative Relative
2020 2021 variation variation (%) 2020 2021 variation (%)
Canillo 240 358 118 49.2% 2,375.0 2,515.6 5.9
Encamp 250 404 154 61.6% 2,110.0 2,322.0 10.0
Ordino 110 153 43 39.1% 2,255.3 2,839.7 25.9
La Massana 245 367 122 49.8% 2,419.8 2,737.6 13.1
Andorra la Vella 206 275 69 33.5% 2,867.6 3,367.3 17.4
Sant Julià de Lòria 106 188 82 77.4% 2,181.3 2,310.1 5.9
Escaldes-Engordany 161 203 42 26.1% 3,160.4 3,203.7 1.4
Total 1,318 1,948 630 47.8% 2,520.4 2,775.1 10.1
Source: Department of Stat st cs.