
Page 86 - economic report 2021
P. 86
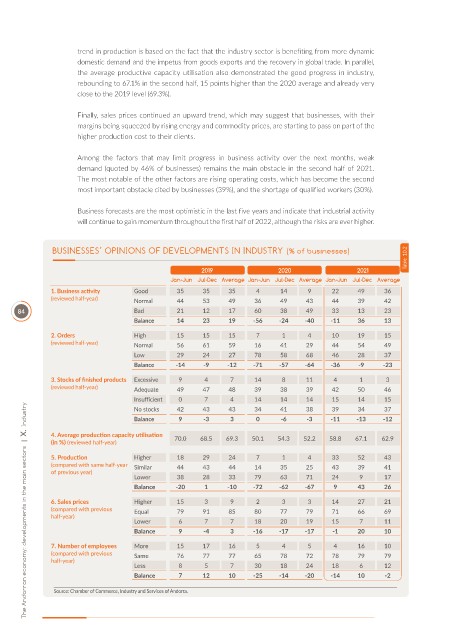
trend in production is based on the fact that the industry sector is benefiting from more dynamic
                     domestic demand and the impetus from goods exports and the recovery in global trade. In parallel,
                     the average productive capacity utilisation also demonstrated the good progress in industry,
                     rebounding to 67.1% in the second half, 15 points higher than the 2020 average and already very
                     close to the 2019 level (69.3%).

                     Finally, sales prices continued an upward trend, which may suggest that businesses, with their
                     margins being squeezed by rising energy and commodity prices, are starting to pass on part of the
                     higher production cost to their clients.

                     Among  the  factors  that  may  limit  progress  in  business  activity  over  the  next  months,  weak
                     demand (quoted by 46% of businesses) remains the main obstacle in the second half of 2021.
                     The most notable of the other factors are rising operating costs, which has become the second
                     most important obstacle cited by businesses (39%), and the shortage of qualified workers (30%).


                     Business forecasts are the most optimistic in the last five years and indicate that industrial activity
                     will continue to gain momentum throughout the first half of 2022, although the risks are ever higher.


                                                                                                            Table  10.2
               BUSINESSES’ OPINIONS OF DEVELOPMENTS IN INDUSTRY (% of businesses)

                                                      2019                2020                 2021
                                              Jan-Jun Jul-Dec Average Jan-Jun Jul-Dec Average Jan-Jun Jul-Dec Average
              1. Business act vity  Good        35    35     35     4      14     9     22     49     36
              (reviewed half-year)  Normal      44    53     49     36     49     43    44     39     42

      84                            Bad         21    12     17     60     38     49    33     13     23
                                    Balance     14    23     19     -56    -24   -40    -11    36     13
              2. Orders             High        15    15     15     7      1      4     10     19     15
              (reviewed half-year)  Normal      56    61     59     16     41     29    44     54     49
                                    Low         29    24     27     78     58     68    46     28     37
                                    Balance    -14     -9    -12    -71    -57   -64    -36    -9     -23

              3. Stocks of f nished products   Excessive  9  4  7   14     8      11     4      1      3
              (reviewed half-year)  Adequate    49    47     48     39     38     39    42     50     46
                                    Insufficient  0    7      4     14     14     14    15     14     15
        The Andorran economy: developments in the main sectors  |  X.  Industry
                                    No stocks   42    43     43     34     41     38    39     34     37
                                    Balance     9      -3     3     0      -6     -3    -11    -13    -12

              4. Average product on capacity ut lisat on   70.0  68.5  69.3  50.1  54.3  52.2  58.8  67.1  62.9
              (in %) (reviewed half-year)
              5. Product on         Higher      18    29     24     7      1      4     33     52     43
              (compared with same half-year   Similar  44  43  44   14     35     25    43     39     41
              of previous year)
                                    Lower       38    28     33     79     63     71    24      9     17
                                    Balance    -20     1     -10    -72    -62   -67     9     43     26

              6. Sales prices       Higher      15     3      9     2      3      3     14     27     21
              (compared with previous   Equal   79    91     85     80     77     79    71     66     69
              half-year)
                                    Lower       6      7      7     18     20     19    15      7     11
                                    Balance     9      -4     3     -16    -17   -17     -1    20     10
              7. Number of employees   More     15    17     16     5      4      5      4     16     10
              (compared with previous   Same    76    77     77     65     78     72    78     79     79
              half-year)
                                    Less        8      5      7     30     18     24    18      6     12
                                    Balance     7     12     10     -25    -14   -20    -14    10     -2

               Source: Chamber of Commerce, Industry and Services of Andorra.