
Page 99 - economic report 2021
P. 99
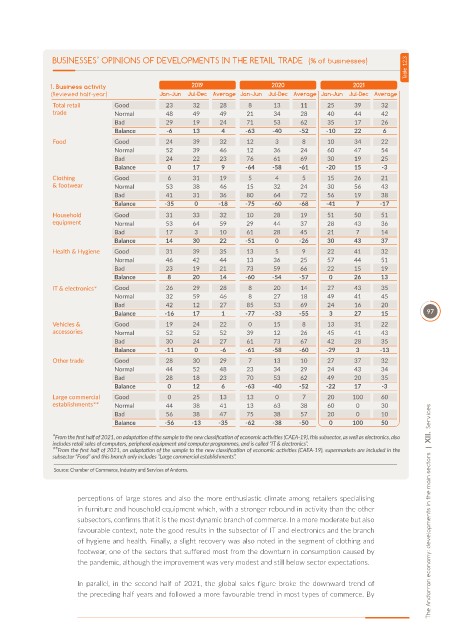
BUSINESSES’ OPINIONS OF DEVELOPMENTS IN THE RETAIL TRADE  (% of businesses)
                                                                                                            Table  12.3


              1. Business activity                  2019                 2020                 2021
              (Reviewed half-year)         Jan-Jun  Jul-Dec Average Jan-Jun  Jul-Dec Average Jan-Jun  Jul-Dec Average
               Total retail    Good          23     32     28     8      13     11     25     39     32
               trade           Normal        48     49     49     21     34     28     40     44     42
                               Bad           29     19     24     71     53     62     35     17     26
                               Balance       -6     13     4      -63    -40    -52    -10    22      6
               Food            Good          24     39     32     12      3      8     10     34     22
                               Normal        52     39     46     12     36     24     60     47     54
                               Bad           24     22     23     76     61     69     30     19     25
                               Balance       0      17     9      -64    -58    -61    -20    15      -3
               Clothing        Good          6      31     19     5       4      5     15     26     21
               & footwear      Normal        53     38     46     15     32     24     30     56     43
                               Bad           41     31     36     80     64     72     56     19     38
                               Balance      -35     0      -18    -75    -60    -68    -41     7     -17
               Household       Good          31     33     32     10     28     19     51     50     51
               equipment       Normal        53     64     59     29     44     37     28     43     36
                               Bad           17     3      10     61     28     45     21      7     14
                               Balance       14     30     22     -51    0      -26    30     43     37
               Health & Hygiene  Good        31     39     35     13     5       9     22     41     32
                               Normal        46     42     44     13     36     25     57     44     51
                               Bad           23     19     21     73     59     66     22     15     19
                               Balance       8      20     14     -60    -54    -57     0     26     13
               IT & electronics*  Good       26     29     28     8      20     14     27     43     35
                               Normal        32     59     46     8      27     18     49     41     45
                               Bad           42     12     27     85     53     69     24     16     20
                               Balance      -16     17     1      -77    -33    -55     3     27     15          97
               Vehicles &      Good          19     24     22     0      15      8     13     31     22
               accessories     Normal        52     52     52     39     12     26     45     41     43
                               Bad           30     24     27     61     73     67     42     28     35
                               Balance      -11     0      -6     -61    -58    -60    -29     3     -13
               Other trade     Good          28     30     29     7      13     10     27     37     32
                               Normal        44     52     48     23     34     29     24     43     34
                               Bad           28     18     23     70     53     62     49     20     35
                               Balance       0      12     6      -63    -40    -52    -22    17      -3
               Large commercial   Good       0      25     13     13      0      7     20     100    60
               establishments**  Normal      44     38     41     13     63     38     60      0     30
                               Bad           56     38     47     75     38     57     20      0     10
                               Balance      -56    -13     -35    -62    -38    -50     0     100    50
               *From the f rst half of 2021, on adaptat on of the sample to the new classif cat on of economic act vit es (CAEA-19), this subsector, as well as electronics, also
               includes retail sales of computers, peripheral equipment and computer programmes, and is called “IT & electronics”.
               **From the f rst half of 2021, on adaptat on of the sample to the new classif cat on of economic act vit es (CAEA-19), supermarkets are included in the
               subsector “Food” and this branch only includes “Large commercial establishments”.

               Source: Chamber of Commerce, Industry and Services of Andorra.


                     perceptions of large stores and also the more enthusiastic climate among retailers specialising
                     in furniture and household equipment which, with a stronger rebound in activity than the other   The Andorran economy: developments in the main sectors  |  XII.  Services
                     subsectors, confirms that it is the most dynamic branch of commerce. In a more moderate but also
                     favourable context, note the good results in the subsector of IT and electronics and the branch
                     of hygiene and health. Finally, a slight recovery was also noted in the segment of clothing and
                     footwear, one of the sectors that suffered most from the downturn in consumption caused by
                     the pandemic, although the improvement was very modest and still below sector expectations.

                     In  parallel,  in  the  second  half  of  2021,  the  global  sales  figure  broke  the  downward  trend  of
                     the preceding half years and followed a more favourable trend in most types of commerce. By