
Page 100 - economic report 2021
P. 100
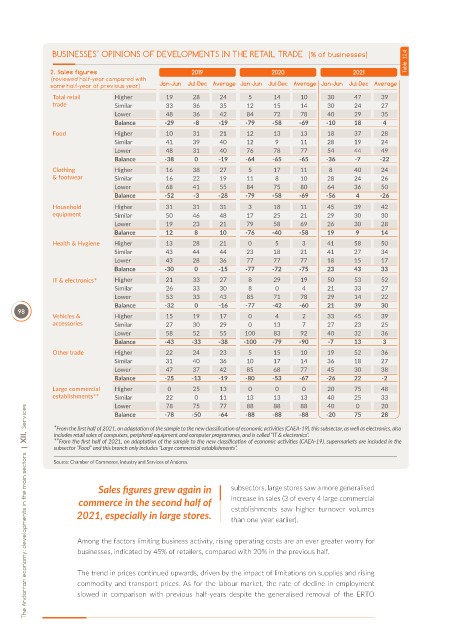
BUSINESSES’ OPINIONS OF DEVELOPMENTS IN THE RETAIL TRADE  (% of businesses)                  Table  12.4

              2. Sales figures                      2019                 2020                 2021
              (reviewed half-year compared with
              same half-year of previous year)  Jan-Jun  Jul-Dec Average Jan-Jun  Jul-Dec Average Jan-Jun  Jul-Dec Average
               Total retail    Higher        19     28     24     5      14     10     30     47     39
               trade           Similar       33     36     35     12     15     14     30     24     27
                               Lower         48     36     42     84     72     78     40     29     35
                               Balance      -29     -8     -19    -79    -58    -69    -10    18      4
               Food            Higher        10     31     21     12     13     13     18     37     28
                               Similar       41     39     40     12      9     11     28     19     24
                               Lower         48     31     40     76     78     77     54     44     49
                               Balance      -38     0      -19    -64    -65    -65    -36    -7     -22
               Clothing        Higher        16     38     27     5      17     11      8     40     24
               & footwear      Similar       16     22     19     11      8     10     28     24     26
                               Lower         68     41     55     84     75     80     64     36     50
                               Balance      -52     -3     -28    -79    -58    -69    -56     4     -26
               Household       Higher        31     31     31     3      18     11     45     39     42
               equipment       Similar       50     46     48     17     25     21     29     30     30
                               Lower         19     23     21     79     58     69     26     30     28
                               Balance       12     8      10     -76    -40    -58    19      9     14
               Health & Hygiene  Higher      13     28     21     0      5       3     41     58     50
                               Similar       43     44     44     23     18     21     41     27     34
                               Lower         43     28     36     77     77     77     18     15     17
                               Balance      -30     0      -15    -77    -72    -75    23     43     33
               IT & electronics*  Higher     21     33     27     8      29     19     50     53     52
                               Similar       26     33     30     8       0      4     21     33     27
                               Lower         53     33     43     85     71     78     29     14     22
                               Balance      -32     0      -16    -77    -42    -60    21     39     30
      98
               Vehicles &      Higher        15     19     17     0       4      2     33     45     39
               accessories     Similar       27     30     29     0      13      7     27     23     25
                               Lower         58     52     55    100     83     92     40     32     36
                               Balance      -43    -33     -38   -100    -79    -90    -7     13      3
               Other trade     Higher        22     24     23     5      15     10     19     52     36
                               Similar       31     40     36     10     17     14     36     18     27
                               Lower         47     37     42     85     68     77     45     30     38
                               Balance      -25    -13     -19    -80    -53    -67    -26    22      -2
               Large commercial   Higher     0      25     13     0       0      0     20     75     48
               establishments**  Similar     22     0      11     13     13     13     40     25     33
                               Lower         78     75     77     88     88     88     40      0     20
        The Andorran economy: developments in the main sectors  |  XII.  Services
                               Balance      -78    -50     -64    -88    -88    -88    -20    75     28
               *From the f rst half of 2021, on adaptat on of the sample to the new classif cat on of economic act vit es (CAEA-19), this subsector, as well as electronics, also
               includes retail sales of computers, peripheral equipment and computer programmes, and is called “IT & electronics”.
               **From the f rst half of 2021, on adaptat on of the sample to the new classif cat on of economic act vit es (CAEA-19), supermarkets are included in the
               subsector “Food” and this branch only includes “Large commercial establishments”.
               Source: Chamber of Commerce, Industry and Services of Andorra.


                           Sales f gures grew again in        subsectors, large stores saw a more generalised

                      commerce in the second half of          increase in sales (3 of every 4 large commercial
                     2021, especially in large stores.        establishments  saw  higher  turnover  volumes
                                                              than one year earlier).

                     Among the factors limiting business activity, rising operating costs are an ever greater worry for
                     businesses, indicated by 45% of retailers, compared with 20% in the previous half.


                     The trend in prices continued upwards, driven by the impact of limitations on supplies and rising
                     commodity and transport prices. As for the labour market, the rate of decline in employment
                     slowed  in  comparison  with  previous  half-years  despite  the  generalised  removal  of  the  ERTO