
Page 76 - economic report 2021
P. 76
The distribution by chapters shows that current transfers, where benefits are accounted for,
reached a total of €299.5 million, 6.2% more than in 2020, a trend that raised its percentage of the
total to 89.9%. This growth is higher than in contributions, for the third consecutive year, limiting
the CASS surplus. Note that this entry also includes the non-contributory benefits financed by
the Government through current transfers and contributory expenditure paid by the CASS for
authorised financial benefits.
The second most important entry in CASS CASS expenditure through current
expenditure is capital transfers (7.5% of the transfers grew more than revenue
total), with five consecutive years of decline
(-22.4% in 2021). The other expenditure, of from contributions, for the third
lesser importance, is divided between personnel consecutive year.
costs, which increased 3.6% (contrasting
with the decline in this entry for the central Government) and represent 1.7% of the total, and
consumption of basic goods and services, which fell 14.3% and only represents 0.5%. Expenditure
on real investment is insignificant, and there was no financial expenditure, as the CASS has no debt.
3.3. General branch of the CASS
The distribution of CASS revenue and expenditure by branches shows that, in the case of the
general branch, the trend in revenue growth from contributions continued to slow significantly,
with an increase of only 1%, to €134.7 million. This deceleration can be explained by the
persistence of the health crisis for a large part of 2021, leading to a drop in numbers of employees.
On the other hand, the numbers of self-employed showed a more positive trend.
74
Box 8.1
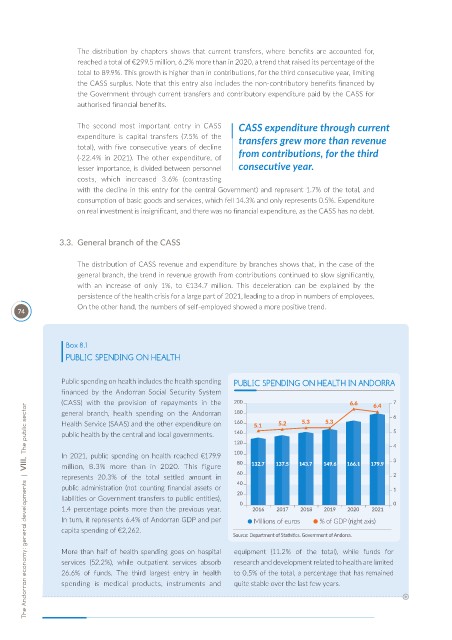
PUBLIC SPENDING ON HEALTH
Public spending on health includes the health spending PUBLIC SPENDING ON HEALTH IN ANDORRA
financed by the Andorran Social Security System
(CASS) with the provision of repayments in the
The Andorran economy: general developments | VIII. The public sector
general branch, health spending on the Andorran
Health Service (SAAS) and the other expenditure on
public health by the central and local governments.
In 2021, public spending on health reached €179.9
million, 8.3% more than in 2020. This figure
represents 20.3% of the total settled amount in
public administration (not counting financial assets or
liabilities or Government transfers to public entities),
1.4 percentage points more than the previous year.
In turn, it represents 6.4% of Andorran GDP and per Millions of euros % of GDP (right axis)
capita spending of €2,262.
Source: Department of Stat st cs. Government of Andorra.
More than half of health spending goes on hospital equipment (11.2% of the total), while funds for
services (52.2%), while outpatient services absorb research and development related to health are limited
26.6% of funds. The third largest entry in health to 0.5% of the total, a percentage that has remained
spending is medical products, instruments and quite stable over the last few years.